Graphic organisers illustrate concepts, and relationships between concepts, using diagrams or tables. They are an effective way of helping readers identify key concepts in a text and to determine the relationship between these concepts. Consequently, they are a useful strategy for improving students’ comprehension skills.
Examples of Graphic Organisers:

Venn Diagrams: Used to compare or contrast information. This could be information obtained from two different sources or two different concepts found within the one text.
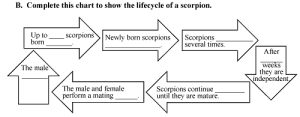
Storyboards or Chain of Events: Used to show the order of a sequence of events.

Timelines: Use to show the timing of events. These can also show duration of events.
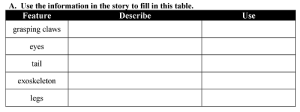
Tables: Tables can be used to demonstrate the relationship of a range of concepts. For example, they can be used to illustrate cause and effect, problems and solutions or identify key information.
All these types of graphic organisers are used in the Cracking the ABC Code Reading for Comprehension books.
Reference
Ae-Hwa, K., Vaughn, S., Wanzek, J., & Wei, S. (2004). Graphic Organizers and Their Effects on the Reading Comprehension of Students with LD: A Synthesis of Research. Journal of Learning Disabilities, 37 (2), 105-117.